
Map topography is the science and practice of representing three-dimensional terrain features on a two-dimensional surface through contour lines, elevation symbols, and relief shading. These specialized maps translate the physical shape of the land into a readable format, showing hills, valleys, slopes, and elevation changes that standard maps omit.
For creative professionals, understanding topographic mapping offers more than geographic literacy. The visual language of contour lines and elevation data provides a framework for thinking about layered systems, depth, and spatial relationships that translates to design work, album art concepts, and organizational planning. The practical benefit is straightforward: Canada offers free, high-quality topographic resources through government repositories that anyone can access and explore.
This article explains how topographic maps work, the types of information they convey, and where to find free Canadian topographic data in 2026. You’ll learn what contour intervals mean, how elevation is encoded visually, and the specific characteristics of Canadian terrain through verified regional examples. The focus is educational and practical, giving you the foundational knowledge to read topographic maps and the direct pathways to access government mapping tools without cost.
Whether you’re curious about the mechanics of terrain representation or looking for visual inspiration from cartographic design, topographic mapping provides a surprisingly accessible entry point into understanding how we translate complex physical landscapes into clear, usable information.
What Map Topography Means
Map topography refers to the detailed representation of the Earth’s surface features on a map, showing the shape, elevation, and physical characteristics of the terrain. While “topography” describes the actual physical features, mountains, valleys, plains, slopes, “topographic maps” are the tools cartographers create to visually represent those features on paper or digital screens.
At its core, topographic mapping translates three-dimensional landscapes into two-dimensional formats that reveal how the land rises and falls. These maps show more than just where features are located; they communicate the vertical dimension of geography, making it possible to understand terrain without standing on it.
- Contour Lines
- Curved lines on a map connecting points of equal elevation, revealing the shape and steepness of terrain through their spacing and pattern.
- Elevation
- The height of a geographic point measured from a reference level, typically sea level, expressed in metres or feet.
- Terrain
- The physical features and characteristics of a land surface, including its slope, texture, and landform composition.
- Relief
- The difference in elevation between the highest and lowest points in a given area, indicating how dramatic or gentle the landscape is.
- Gradient
- The rate of elevation change over distance, describing how steeply land rises or falls along a particular direction.
Understanding these concepts unlocks the ability to read landscapes from maps. When contour lines cluster tightly together, they indicate steep slopes; when they spread apart, the terrain is gentle. Elevation markers provide specific height measurements at key points, while colour coding or shading often enhances the visual interpretation of relief. Canadian topographic resources, for instance, display average elevation data, Gaspésie sits at 190 metres, Centre-du-Québec at 132 metres, giving users immediate insight into regional terrain characteristics.
The distinction between topography as physical reality and topographic maps as representation matters because the map is always an abstraction, a selective translation of landscape into symbols and lines designed for human interpretation.
How Topographic Maps Work
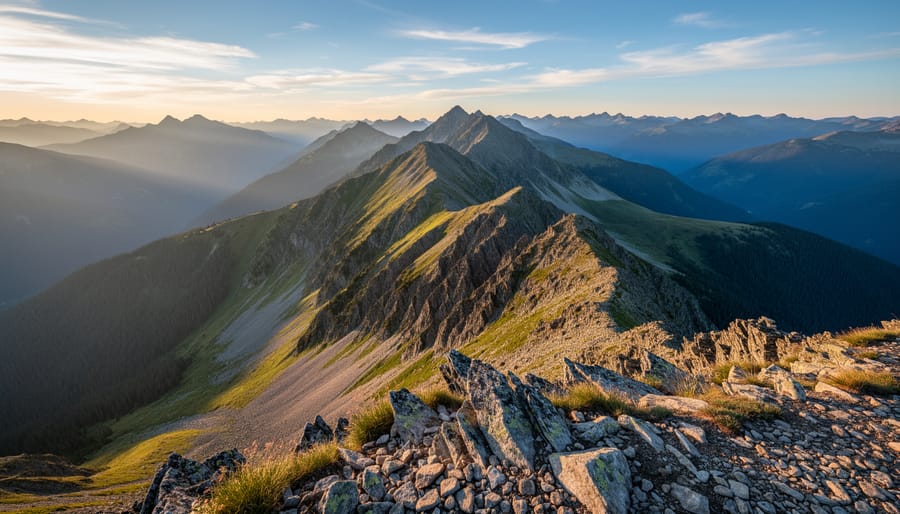
Topographic maps solve a fundamental visualization challenge: showing three-dimensional terrain on a flat surface. They accomplish this through contour lines, curved lines connecting points of equal elevation. When you see contour lines packed closely together, the terrain rises or falls steeply; widely spaced lines indicate gentle slopes. Each line represents a specific elevation interval, creating a visual signature of hills, valleys, ridges, and plains without requiring 3D rendering.
Reading these maps becomes intuitive once you understand the basic mechanics. A peak appears as concentric circles with the smallest circle at the highest point. Valleys show V-shaped contour patterns pointing uphill, following watercourses downward. Ridges form similar V-shapes but point downhill, marking high ground between drainages. The vertical distance between contour lines, called the contour interval, varies by map scale and terrain complexity, typically ranging from 10 to 100 meters depending on the region being mapped.
Topographic maps display several essential elements:
- Contour lines connecting points of equal elevation
- Line spacing indicating slope steepness (close = steep, wide = gentle)
- Elevation markers for peaks, valleys, and significant terrain features
- Color coding to represent different elevation zones
- Labels showing average elevation for regions
Canadian topographic mapping follows rigorous national standards, with digital platforms now making this data widely accessible. The Canada topographic maps page provides free visualization and sharing of topographic maps, allowing users to click on any map to view its topography, elevation, and terrain details interactively. These tools display verified elevation data, Gaspésie shows an average elevation of 190 meters, Centre-du-Québec sits at 132 meters, Trois-Rivières at 37 meters, and Nunavut rises to 387 meters, giving researchers and curious explorers immediate access to accurate terrain information across dramatically varied Canadian landscapes.
Scale matters significantly. A 1:50,000 scale map shows more terrain detail than a 1:250,000 map, though the latter covers a larger area. Understanding scale helps you judge distances and interpret how terrain features relate spatially, whether you’re analyzing watershed patterns, planning infrastructure, or simply exploring how land shapes human settlement and movement across regions.
Types of Topographic Information
Topographic information comes in several forms, each serving different purposes for understanding terrain. Physical elevation maps are the most common type, using contour lines and colour gradients to show height variations across a landscape. These maps display how the land rises and falls, making visible features like mountains, valleys, and plateaus. Terrain classification divides landscapes into categories based on slope, surface material, and landform characteristics, useful for environmental planning and land management.
Relief mapping adds a three-dimensional quality to topographic representation. These maps use shading and visual depth to create the impression of terrain you could almost touch. Digital elevation models (DEMs) take this further by storing terrain data as precise numerical values for each point on a map, allowing sophisticated computer analysis and visualization.
Canada’s geographic diversity makes topographic variation particularly striking. Gaspésie, with its average elevation of 190 metres, presents rolling highlands and coastal terrain. Centre-du-Québec sits lower at 132 metres average elevation, characterized by gentle agricultural plains. Trois-Rivières, at just 37 metres, occupies near-water-level land along the St. Lawrence River. Nunavut’s 387-metre average elevation reflects its Arctic plateau and tundra landscape, a vast, sparsely populated territory where elevation changes shape wildlife patterns and human settlement.
Free topographic maps make this information accessible beyond professional geographers. Visualization and sharing platforms allow anyone to explore Canadian terrain data, clicking on regions to view topography, elevation, and terrain details interactively. These resources serve researchers, outdoor enthusiasts, educators, and anyone curious about the physical shape of the land. Whether you’re studying watershed patterns, planning a backcountry route, or simply appreciating the variety of Canadian landscapes, topographic data offers a window into the earth’s surface structure.
Applications of Topographic Mapping
Topographic mapping supports a range of professional and practical applications, from geographic research and environmental planning to infrastructure development and outdoor navigation. Researchers use detailed elevation data to study landscape evolution, watershed management, and climate impact on terrain. Urban planners and engineers rely on topographic information to design transportation routes, assess flood risk, and plan construction projects that account for natural elevation changes. The NRCan Open S&T Repository provides free access to government science publications, including studies of Canadian topographic maps that inform ongoing research and policy development.
Beyond technical disciplines, topographic mapping serves outdoor recreation communities. Hikers, backcountry skiers, and paddlers consult topographic maps to navigate terrain, identify safe routes, and understand elevation gain. Event organizers planning outdoor Canada festivals or gatherings in remote locations use topographic data to assess site suitability, access points, and natural features that might affect logistics.
Topographic concepts also extend into creative and conceptual work. Visual artists and designers draw inspiration from the aesthetic qualities of contour lines and relief representation. The principles of topographic mapping translate into frameworks for visualizing complex, layered systems in fields ranging from data visualization to strategic planning. Understanding how elevation and terrain features are represented on maps offers a model for thinking about spatial relationships, hierarchies, and the interplay between surface and depth in any domain. This crossover appeal makes topographic literacy valuable beyond geography itself.
Accessing Canadian Topographic Resources
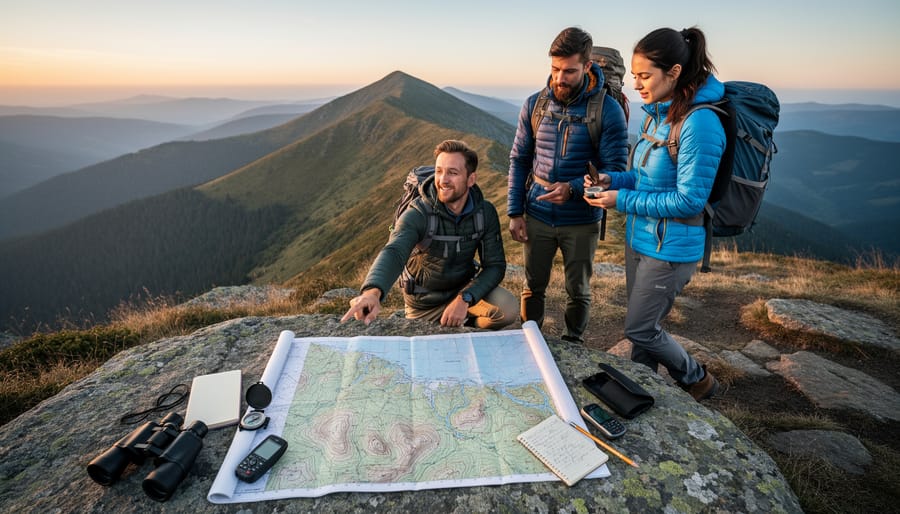
Canada offers several free, government-supported resources for accessing topographic data, making it straightforward for researchers, educators, and creative professionals to explore the country’s diverse landscapes. These tools require no specialized software or paid subscriptions, providing open access to detailed terrain information across all regions.
The primary source for interactive topographic visualization is the Canada topographic maps platform, described as a tool for visualization and sharing of free topographic maps. This resource allows users to click directly on map areas to view topography, elevation, and terrain details for any location. Regional data displays average elevation figures, for example, Gaspésie shows 190 m, Centre-du-Québec 132 m, Trois-Rivières 37 m, and Nunavut 387 m, illustrating the wide elevation range across Canadian geography.
For more in-depth research, the NRCan Open S&T Repository (OSTR) provides free and open access to science publications and research funded by the Canadian government. This repository includes topographic studies and technical reports, such as studies of Canadian topographic maps, offering valuable context for understanding mapping methodologies and regional terrain characteristics.
To access these resources effectively:
- Identify the specific region or landscape feature you want to explore
- Use the free visualization platform to navigate to that area
- Click on interactive map sections to reveal elevation and terrain data
- Review the displayed topographic information for your needs
- Explore the OSTR for detailed government research publications when deeper analysis is required
These platforms serve diverse purposes, from academic research and environmental planning to creative projects inspired by landscape patterns. The accessibility of Canadian topographic data supports both practical applications and conceptual exploration of how terrain shapes regional identity and visual aesthetics.
Topography in Creative and Professional Contexts
Topographic principles translate naturally into creative and professional fields through their core strength: visualizing complex relationships and hierarchies. Understanding how elevation, relief, and spatial positioning work on physical maps offers a framework for thinking about layered systems in any domain.
In visual design basicstopographic aesthetics appear in album artwork, concert posters, and brand identity work. Contour lines, gradient layering, and elevation-style depth create visual interest and suggest dimension on flat surfaces. Designers borrow these techniques to add texture and movement to static images.
Beyond direct visual application, topographic thinking helps map abstract systems. Charting the structure of rights flows in music publishing, for instance, resembles creating a terrain map: identifying high points of value, tracing paths between entities, and understanding where complexity clusters. A design tool or strategic planning exercise benefits from this spatial approach to visualizing relationships.
The concept scales from micro to macro. A songwriter might map emotional intensity across a composition’s structure, treating dynamics like elevation changes. An organization might chart stakeholder influence or resource distribution as a topographic field. The metaphor works because it turns abstract complexity into something you can see, navigate, and understand at a glance, the same reason physical topographic maps remain valuable after centuries of use.
Common Questions About Map Topography
How do you access topographic maps in Canada?
Canadian topographic maps are available through free government resources, including platforms that let you click on a map to view its topography, elevation, and terrain. The NRCan Open S&T Repository provides free access to government-funded topographic research and publications.
What information do topographic maps show?
Topographic maps display terrain features including elevation changes, landforms, surface characteristics, and physical landscape details. They use contour lines, elevation markers, and visual symbols to represent three-dimensional terrain on a two-dimensional surface.
How are elevation measurements displayed on topographic maps?
Elevation appears through contour lines connecting points of equal height, numerical markers showing specific heights above sea level, and sometimes average elevation data for regions. Canadian examples include Gaspésie at 190 m average elevation, Centre-du-Québec at 132 m, Trois-Rivières at 37 m, and Nunavut at 387 m.
Where can I find free Canadian topographic data?
Free topographic data is available through government repositories designed for visualization and sharing. The NRCan Open S&T Repository offers open access to Canadian topographic studies and research funded by the federal government.
These questions reflect what people actually search for when learning about topographic mapping. Whether you’re researching geographic features, planning outdoor activities, or exploring landscape visualization for creative projects, understanding how to access and interpret topographic information makes these resources practical and approachable. The availability of free Canadian data removes barriers to geographic literacy and spatial understanding.
Map topography offers a powerful lens for understanding physical landscapes through precise visual representation. Whether you’re examining the dramatic elevation changes across Canadian regions, from Trois-Rivières at 37 metres to Nunavut’s 387-metre average, or exploring terrain features that define our geographic reality, topographic mapping translates complex three-dimensional space into accessible two-dimensional knowledge.
The accessibility of Canadian topographic resources makes this knowledge democratically available. Government repositories like the NRCan Open S&T Repository provide free access to research and publications, while visualization platforms allow anyone to click on maps and immediately view elevation, terrain, and topographic details. This openness supports geographic education, environmental research, and infrastructure planning across disciplines.
Beyond literal geography, topographic thinking, the ability to visualize layers, understand relationships between elements, and map complex systems, carries value across professional and creative fields. The same principles that help us read contour lines and interpret elevation can inform how we approach any layered, multidimensional challenge. Exploring topography builds spatial literacy and analytical frameworks useful wherever we need to understand how components relate across a landscape, whether that terrain is physical or conceptual.